A Basic Introduction to Pairs Trading
Pairs trading or Statistical Arbitrage is a stock trading strategy that attempts to be market neutral and capture the spread between two correlated stocks as they return to the mean price. It is known by some as “statistical arbitrage”, but “pairs trading” is the more common name used to refer to this technique.
Simply stated, it is the buying and simultaneous selling of two stocks that follow each other when they diverge from the normal pattern; in the expectation that the normal pattern will soon resume. In other words, traders find two stocks that tend to move together. The trader would buy Stock A and sell Stock B short.
Click here to learn how to utilize Bollinger Bands with a quantified, structured approach to increase your trading edges and secure greater gains with Trading with Bollinger Bands® – A Quantified Guide.
Pair trading is also done with options, futures, and baskets of stocks but that is fodder for future articles. This article will cover the basics of pairs trading by showing you a simple 4-step method for pairs trading. I’ll also provide examples and point you in the right direction for more information on this highly effective stock trading tactic often used by trading professionals.
Here is the simple 4 step method to get started in pair trading.
Step 1. Choose the Stock Pair
This may sound like the most difficult part of the process, but it’s actually quite simple in its most raw form.
There are numerous complicated methods for choosing the pair of stocks, but it all boils down to finding two stocks that are correlated in movement. Start out by looking for stocks that make sense to be similar.
Here are several examples:
Coca-Cola
(
KO |
Quote |
Chart |
News |
PowerRating) and Pepsi
(
PEP |
Quote |
Chart |
News |
PowerRating)
Wal-Mart
(
WMT |
Quote |
Chart |
News |
PowerRating) and Target
(
TGT |
Quote |
Chart |
News |
PowerRating)
Ford
(
F |
Quote |
Chart |
News |
PowerRating) and General Motors
(
GM |
Quote |
Chart |
News |
PowerRating)
These are just a tiny few of the stocks that can be used in pairs trading because of their correlation in movement.
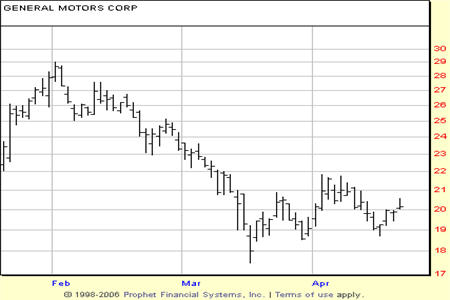
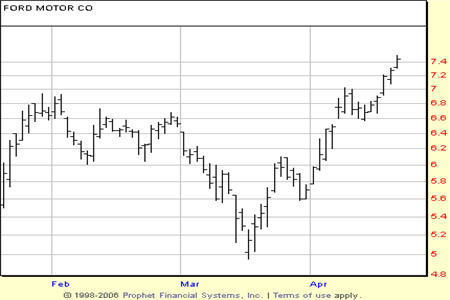
Step 2. Visually Confirm Correlation Using Charts
Eyeballing price charts is a very basic way to determine correlation of pairs. Look at charts of stocks that you think should be correlated to find several that truly move together. There are many more complex ways to do this, but this way is the most simple.
Step 3. Create a Price Ratio Chart
This is another complicated sounding, but actually simple, procedure. Most charting platforms can do this for you automatically.
A Price Ratio Chart It is a chart of both stocks plotted together. It is calculated by dividing one stock price into the other. These are normally line charts and measure deviation from the mean or average spread between the two stocks in the pair.
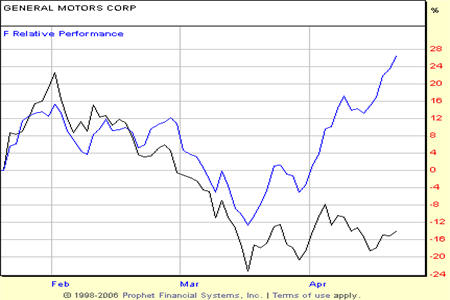
Step 4. Buy One Stock. Sell One Stock Short
When the price ratio line moves to its first or second deviation from the mean it’s time to enter the trade. You want to go long the lagging stock and short the over performer.
Your profit is anywhere in the spread as it comes back to the mean. When you start out, match dollar value in each stock and not share number, this keeps things equal in the moves. There are many ways to size the trades, this is just the most rudimentary method.
This is pair trading in its most simple form. It’s not a fool proof method. Traders can and do lose money. However pairs trading is a proven method for consistent profits. Most importantly, remember to utilize stops when pair trading. It is possible that both sides of the trade can lose, so know how much you are willing to lose prior to executing your first pairs trade.
Good luck!
Dave Goodboy is Vice President of Marketing for a New York City based multi-strategy fund.