A Simple Day Trading Strategy
Working with traders around the world I’ve noticed a common theme. Day traders make trading way too complicated! They plot dozens of indicators on their trading screen and then fail to enter trades with confidence. In this article you will learn how to have confidence in your trading decisions by using a simple day trading strategy that only relies on two indicators.
What Are The Best Markets For This Trading Strategy?
This strategy is a simple trend following strategy that should work in any market, but as a day trader I prefer to trade futures. At Rockwell Trading, we trade this strategy live in our Live Trading Rooms on the following markets:
- E-mini S&P
- E-mini Dow
- E-mini S&P MidCap
- FX Euro
- 30-Year T-Bonds
How To Set Up Your Charting Software
When selecting a timeframe, we prefer tick charts for this strategy. If you’re not familiar with tick charts, a tick bar completes after a specific number of trades, instead of a time frame like a 5 or 15 minute bar. As an example, I use a 4,500 tick chart for the E-mini S&P. This means that a bar or a candle is plotted every 4,500 trades. A bar can take 2 to 5 minutes to complete, but the actual time it takes to complete really doesn’t matter. All that counts is the amount of trades that have been executed in the market.
The advantage of using tick charts is that the number of bars will increase and decrease depending on volatility. When the markets are moving and there are more trades, you will have more bars. If the markets are quiet you will have fewer bars.
As an example, a setting of 4,500 trades for the E-mini S&P will typically produce between 7 and 10 bars during the 17 hour overnight session (16:30 pm EST and 9:30 am EST) since the E-mini S&P is not actively traded during this time. However, in the first two hours of active trading (between 9:30 am and 11:30 am EST), you can expect between 16 and 24 bars, depending on the trading activity of the day.
Tick charts remove the time factor from charts and add volume and volatility to your bars. Give it a try and you’ll probably find that tick charts are an easier way to see intraday movements in the markets you trade.
Note: We update tick settings for the markets we follow 2-3 times per year, since volatility in the markets can change.
The next step is to add the popular MACD Indicator to the chart. Just use the standard settings:
- 26 for the slow moving average
- 12 for the fast moving average and
- 9 for the moving average of the MACD – the “signal line”
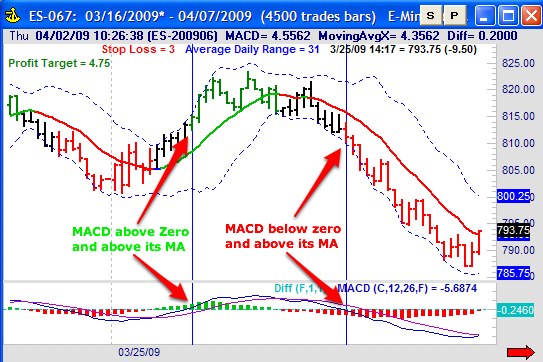
I am using the MACD to identify the direction of the market, but I am using it with a little twist:
- The market is in an uptrend if the MACD is above its signal line and above the zero line.
- The market is in a downtrend if the MACD is below its signal line and below the zero line.
My charting software allows me to color the bars based on certain criteria, and therefore I am coloring the bars in an uptrend (according to the definition above) green and the bars in a downtrend red.
To avoid being whipsawed in a sideways market and to only catch strong trends, we are adding a second indicator: Bollinger Bands. We are using the following settings:
- 12 for the moving average
- 2 for the standard deviation
You can find intraday trading opportunities all day long — with the TradingMarkets Live Screener featuring real time updates on 20 popular price and technical indicators … Click here to learn how.
Entry Signals
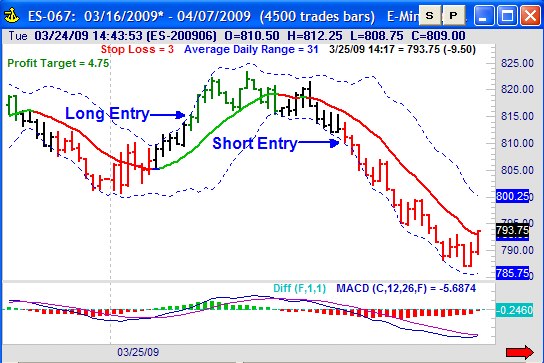
We use the Bollinger Bands to determine our entry signal:
- Enter LONG with a stop order at the value of the Upper Bollinger Band if the market is in an uptrend (see definition above). If you are not filled, adjust your stop order to reflect the Upper Bollinger Band value as long as we remain in an uptrend.
- Enter SHORT with a stop order at the value of the Lower Bollinger Band if the market is in a downtrend (see definition above). If you are not filled, adjust your stop order to reflect the Lower Bollinger Band as long as we remain in a downtrend.
By using stop orders we will only be triggered if price pushes through the Bollinger Band, which can signal a continuation of the trend. You will see that these simple rules allow you to catch a strong trend, and that the use of the Bollinger Bands will help you avoid many “false signals”.
Exit Signals
In our Simple Trading Strategy we are using volatility-based exits. Our goal is to accommodate different market conditions by using wider stops and profit targets in a volatile market, while using smaller stops and profit targets in a quiet market.
We measure the volatility of a market using the Average Daily Range (ADR). In order to calculate the ADR, we measure the distance between the Daily High and the Daily Low, and build an average over the past seven days:
{(High of yesterday – Low of yesterday) + (High of 2 days ago – Low of 2 days ago) + (High of 3 days ago – Low of 3 days ago) + … + (High of 7 days ago – Low of 7 days ago)} / 7
In the chart below you can see that the daily range on March 25th, 2009 in the e-mini S&P was 36 points. You simply calculate this range for the past 7 days and get the Average Daily Range (ADR):
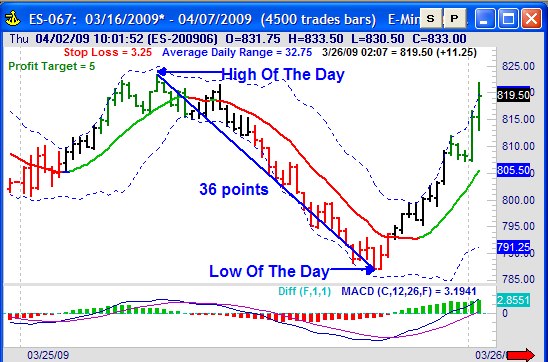
We use this ADR to calculate our stop loss and profit target:
- Stop Loss = ADR * 0.10
- Profit Target = ADR * 0.15
As you can see, we are using 10% of the Average Daily Range as a stop loss and 15% of the ADR as a profit target. I highly recommend using a profit target to take profits and get out of a trade before it turns against you.
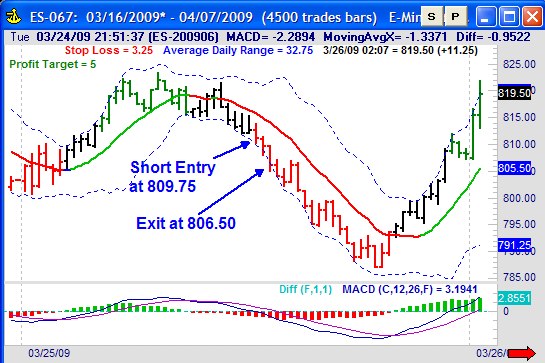
In addition to our profit target and stop loss, we will close a trade if a bar completes and we see a MACD crossover. If we are long and MACD crosses back below the signal line, or short and MACD crosses back above the signal line, we want to close the trade to get out of a position in case the trend reverses.
Summary
This strategy is a Simple Day Trading Strategy that’s easy to understand and execute. Test it out and you will be surprised at how robust it is. Once you are familiar with the basic rules, consider incorporating your personal trading preferences like scaling in and out of a position, using trailing stops or any additional filters that you are comfortable with.
All the best in your trading.