Here’s How to Find Top Performing Stocks Every Day
The question isn’t “Is the market efficient?” but
rather “How inefficient is the market?” and “How can we exploit this?” – Edward Thorp.
Over the many decades of academic studies and research done
by market professionals, nearly everything imaginable has been tested in an
attempt to predict the direction of a company’s stock price. P/E ratios,
dividend yield, revenue growth, book value, earnings growth, etc. have been
looked at over and over. The one conclusion that can be made from these studies
is that few, if any of them, show a real statistical edge. The one area which we
believe remains fertile ground for further research is price behavior.
Click here to order your copy of The VXX Trend Following Strategy today and be one of the very first traders to utilize these unique strategies. This guidebook will make you a better, more powerful trader.
What is price? It’s essentially a culmination of all the
known information of a company. Therefore, price is real as it represents what
the majority of the market participants know at that given time.
Finding Market Inefficiencies
Shorter-term, we believe that markets (prices) can be very
inefficient. We have published some of these inefficiencies over the years and
we’ll continue to publish them over time. Most of these short-term
inefficiencies tend to occur whenever there is either news in a stock, or there
is a great deal of fear in the market place. One only has to think about what
happened in the summer of 2007 to fully understand these inefficiencies. Solid
performing companies saw 20%, 30% and 40% of their value lost in a few days as
market participants (primarily institutions) irrationally sold stocks, only to see
the prices of many of these stocks quickly bounce back to their previous levels.
These types of market inefficiencies can be found on a regular basis in
individual stocks, especially on unexpected news-related events, or when market
volatility rises.
Longer-term, markets are supposedly more efficient. This is
the concept that has been taught by many in the academic world. But, if it
was true, you wouldn’t expect low volatility stocks to outperform high
volatility (and often times high beta stocks) by a better than 2-1 margin since
1995, would you? But they have…
How to Find Safe High Probability Stocks
Is it possible to increase your investment returns using
only price as an indicator? We believe the answer is yes, it is. And here’s how
you do it.
First, the one indicator that best measures the movement of
a stock (and based upon the statistics is the best indicator to predict a stocks
direction over the next year) is historical volatility.
What is historical volatility? Volatility is the annualized
standard deviation of daily returns (don’t get scared away…it gets simpler from
here). Simply stated, it’s the movement of a stock price without regard to
direction. Large average daily stock price changes (in percentage terms) mean
high volatility, and small average daily price changes mean low volatility.
Stated another way, the more a stock moves, the higher its volatility. The less
it moves, the lower its volatility.
Companies that are stable and are usually performing in-line with
expectations tend to have lower volatility (this is logical, as these companies
are more predictable). Companies that have a great deal of uncertainty to
them (think about the sub-prime lenders in 2007) tend to have higher
volatility as more is unknown.
Do You Invest High-Flying Stocks? Be Careful…
Now, the key thing to learn is that since 1995, high
volatility stocks have underperformed the market. In fact, on average, the majority has been
lower 252 trading days later.
On the other side of the equation, low volatility stocks have outperformed the market. And, on average, the
majority have been higher 252 trading days later.
Let’s look at the test that confirms this, and then we’ll look
at the results:
- We ran these test results from January 1, 1995 through May 31,
2007. - The universe of stocks we ran them on had a dynamic volume filter, to assure we were looking at the liquid stocks, and numbered
11,282 different stocks. - Survivorship bias has been omitted (meaning all
stocks that were public during this period of time were included in our
universe). - Trading costs were not included.
- We looked at every stock, every trading day. This means that we took the
universe of stocks each trading day, calculated their historical volatility
for that day and then looked at their performance 252 trading days (one-year)
later.
Each day we ranked the 100-day historical volatility of all
the stocks in our universe (we also tested using a 250-day HV and got similar
results, further showing the significance of these tests). We then compared the
252-day performance of the stocks which were in the top 20% of volatility (the
20% with the highest volatility) versus the 20% with the lowest volatility.
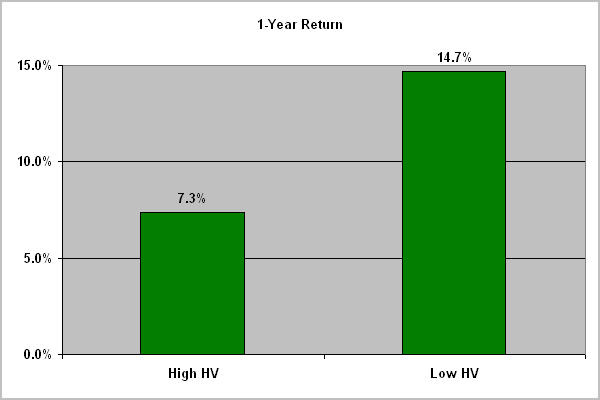
As you can see, the stocks in the lowest 20% ranked by
historical volatility outperformed the stocks with the highest volatility by a
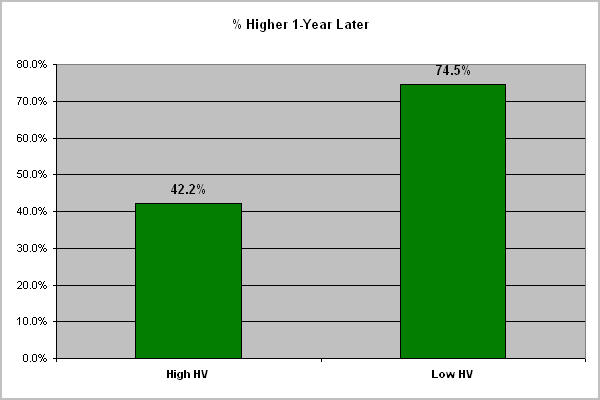
better than 2-1 margin 252 days later. And the stocks with the lowest volatility
rose 74.5% of the time 252 days later, while the stocks with the highest
volatility rose only 42.2% of the time, a significant difference.
And
this difference gets even greater if you compare the lowest 10% with the highest
10%. For the lowest 10%, prices rose 77% of the time 252 days later, while the highest
10% rose only 39% of the time (meaning 61% of the time prices were lower 252
days later!).
One caveat to the above; the only time during the test
period this didn’t seem to hold true was in mid 1998-1999 when the internet
bubble was being formed. Money was chasing the high volatility stocks and many
of those stocks moved only in one direction. Therefore if you removed the bubble
period, the returns for the highest volatility stocks would be even worse. In
reality, as poor as the results have been for the most volatile stocks, they’d
be even worse without the 1998-99 bubble! This is something to think about
the next time you see or hear someone recommending some high-flying stock as the next sure
thing.
Summary
Trading high volatility stocks may be a
good idea if you are looking for short-term gains. But for investing, it appears
to be a recipe for underperformance and even potentially for disaster. We can
show you many high flying stocks with extreme volatility that collapsed in price over
the next twelve months. The safer and more prudent thing to do, is to identify
stocks with lower historical volatility readings. A 100-day historical
volatility reading under 30 is a good place to start. Since 1995, on average,
better than 70% of these stocks have been higher 252 days later. This is a
long-term track record that very few (if any) money managers and professionals
can come close to replicating.
We’ll continue to publish our research on this topic over
time. If you would like to see lists of stocks which incorporate the above
research, you can find them at www.PowerRatings.net.
Larry Connors is CEO and Founder of TradingMarkets.com and PowerRatings.net.
Cesar Alvarez is Managing Director of Connors Research LLC.