How to Read an Options Chain
Whether a trader is looking to pad a long position by writing a covered call or buy a protective put for shares that the trader has shorted, knowing how to read an option chain should precede either one of these potential strategies.
The option chain lists the available call and put strike prices for an underlying security. It also lists the month of expiration for each available option. It is important to keep in mind that one call option, is a contract that gives the holder the option to purchase 100 shares of the underlying security. A put option, is a contract that gives the holder the options to sell 100 shares of the underlying security.
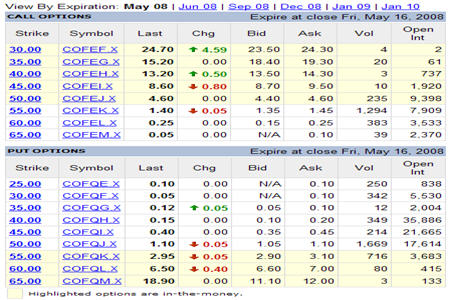
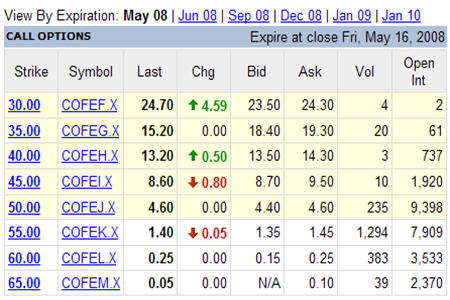
In the options chain above, the call options are listed on the top and the put options on the bottom. In this instance the options listed are for Capital One Financial common stock. The month of each expiration date are listed horizontally across the top of the screen. As the trader clicks on the month, the exact date of expiration appears.
Strike
The strike price, also know as the exercise price, is listed in the first column. In the case of a call, this is the fixed price at which a trader can purchase the underlying security. In the instance of a put, it is the fixed price at which the option holder can sell the underlying security. The strike price is independent of the current market price of the security.
Options that are “in-the-money” are highlighted. For a call option to be “in the money”, the current market price must be greater than the strike price. For a put option to be in-the-money, the current market price must be less than the strike price.
Symbol
Just as stocks have ticker symbols, so do options. The symbol is merely a way of identifying the strike price and month of expiration for the option in question. For example in the case of Capital One, the May $60 call option has the ticker COFEL.X. The symbol is listed in the second column.
Last
The third column shows the price at which the last trade for that specific option was executed at. It can be thought of as the market price for the option, or a “quote” for the option. In the case of Capital One, the May $40 put option is trading at $0.15 per put option.
Change
The next column lists the change in price of the option. Generally, it shows the trader by how much the option has risen or fallen since the previous market close.
Bid/Ask
The next two columns refer to an option’s current bid price and its current asking price. Taken together these two numbers are more commonly known as the bid/ask spread. If a trader were to buy an option, they would end up paying an amount approximately equal to the listed ask price to acquire that option. If a trader was looking to sell or “write” an option, the trader would receive the listed bid price for that option.
Volume
The volume column lets the trader know how many option contracts have been traded during the trading day.
Open Interest
The final column shows the open interest for the option. The open interest lets the trader know how many open contracts that are in existence since the option was open for trading. Options that have been sold or exercised to close a position, are deducted from the open interest number.
Using An Option Chain In Practice
Once a trader is able to read the option chain, the trader is able to put this knowledge to work. To see an option used in practice, let’s take the case of the May $50 call option for Capital One. Let’s assume that the current market price of Capital One shares is $54, but we expect shares to go higher before the option expires on May 16. Looking at the ask price of $4.60 per contract, the trader could expect to pay around $460 for one call option that would give them the right to buy 100 shares of Capital One at $50.
As long as the option is “in the money”, it is in the trader’s best interest to exercise the call option prior to expiration. Because there is a cost to the option, $460 in this case, the trader is actually expecting shares of Capital One to go above $55. $55 is the break-even point, because at $55, the trader is able to buy 100 shares at $50 (for a total of $5,000) using the call option and then turn around and sell the 100 shares at $55 on per share on the open market for a total of $5,500. After taking into account the $460 premium to purchase the option, the trader is now roughly even.
For traders who are new to options, an option chain can seem a little bit complicated when seen for the first time. Once the trader knows how to read an option chain, the trader is well on their way to being able to utilize options to hedge risk in daily trading.
Billy Fisher is a CPA and a freelance investment writer whose work has appeared in Investor’s Business Daily, TheStreet.com and SmallCapInvestor.com. He holds a master’s degree in accounting from the University of Notre Dame and a bachelor’s degree in accounting from Canisius College.