How to Successfully Trade the Russell 2000 E-mini Futures, Part 2
In part 1 of his article on the E-mini Russell 2000 futures, Austin Passamonte discusses how to trade the new Russell on the ICE exchange. To read part 1, click here.
A pretty big inflow of questions, comments and concerns regarding Russell 2000 e-mini futures were received. Judging from feedback, it appears the TF futures traders are alive & well for a return to their previously favored symbol. Let’s cover a few of the popular points of concern in greater detail this time around.
Click here to learn how to utilize Bollinger Bands with a quantified, structured approach to increase your trading edges and secure greater gains with Trading with Bollinger Bands® – A Quantified Guide.
Small-Market Influence
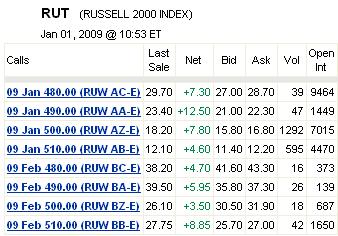
Like we discussed before, Russell 2000 futures pretty much serve as a market-maker’s hedge for IWM shares (Russell 2000 index) and/or baskets of bigger small-cap stock positions. The RUT index options (see tables below) and IWM options (not shown) are secondary derivative instruments for hedging stocks & ishares or creating sideways trade strategies for Russell 2000 products. The numbers shown for RUT index options are pretty thin volume and open interest relative to SPX (and OEX) index options based on S&P 500 index futures pricing.
RUT.X Russell 2000 Index Option Chain
In other words, there are limited few ways for R2000 index traders to work sideways strategies compared to S&P 500 or even Nasdaq 100 indexes. The two big indexes have numerous products each and/or combined between them for inter-market hedging strategies. That is fundamentally why TF futures have straighter, more directional price movement compared to the ES and even NQ. A market which is working higher from point A to B or lower from point B to A can do so in more deliberate fashion if it has less sideways pressure. The myriad combos and ways that S&P markets are gamed sideways for arbitrage strategies inhibit straight line movement. Yes, the ES/SPY will eventually go from A to B or B to A just like anything else. But the path taken to get there will always be more ragged & jagged as the faders and arbs press counter-direction plays persistently.
It is the thin liquidity of R2000 index overall due to smaller markets in general AND outside listing off CME to prevent intra-exchange spreads that preserves TF futures from excessive back & fill behavior between trips from point A to B or B to A. That’s not to say that “thin is in” for all applications… there are drawbacks to less liquid markets. When volume and open interest fall below certain zones, methodical price action turns spastic and erratic.
TF Bid/Ask Spread
Lots of former ER2 traders are either watching or dabbling with the TF contract. Questions on volume and open interest are something I get plenty of on a regular basis. Right now (prior to the holiday lull period) the TF contract has roughly 1/2 to 2/3 average volume that ER2 at its zenith did. The TF contract regularly trades a 2-tick wide bid/ask spread, sometimes flaring wider than that during fast market periods that surprise the tape. Also, the bid/ask is so wide and erratic before 9am est that pre-market trading in TF is pretty much impossible.
During the cash session itself, price spike whipsaws of 3pts ~ 5pts wide can and do happen regularly around the opening and closing bells. Block orders to start or end a session will send the tape absolutely haywire in split seconds. That of course is due to big block orders being filled across several strikes which then dominos other resting stop orders that trigger others in tsunami fashion. These violent whips happen in mere seconds, with absolutely no time to react for trade entry or management decisions when they go off. One of many reasons to ALWAYS have resting stop-loss orders in place when trading e-mini futures, regardless of market or symbol. Period.
TF Slippage And Fills
On the other side of that liquidity coin, TF futures often close out trades with positive slippage. For example, a short trade at 499.00 and resting stop-loss at 500.50 to protect will quite often be hit on the ask @ 500.50 or 500.60 but fill @ 500.40 closed between the spread as pricing moves around. Said another way, price movement back and forth through a 2-tick spread can just as easily result in a market ticking back in your favor when stopped instead of pushing further for greater than expected loss.
That’s a hard concept for most traders to grasp… because they are thinking logically from a selfish point of view. The assumption is a stopped-out trade being one sided event. Keep in mind there are orders resting at every strike going the opposite of yours. If your buy stop at 500.50 is hit on a two-contract order while sixty contracts to sell short are resting on that exact strike with only forty contracts offered, your two-lot will get shoved backwards in your favor while the fifty-lot completes filling one tick lower than expected by those sellers. They experienced negative slippage by -1 tick… which is why in this specific example you enjoyed positive slippage of +1 tick.
Two sides to every order on each strike. When trading less liquid instruments, slippage can go either way depending on which size is greater at the strike. If your trade happens to be within the bigger size collectively, your slippage (if any) will be negative. If your trade happens to be within the smaller size collectively, your slippage (if any) will be favorable. Many times there will be no slippage in TF at all… positions entered or exited are filled on the mark.
Of course there are reasonable size limits to how many TF contracts can be traded before persistent slippage becomes an issue. Someone trying to fill 20 contracts opened long or short on limit orders will experience numerous partial fills on profitable trades. That’s the tough part. Losing trades will always fill complete orders because the market is moving against you. Heck, you can fill hundreds of contracts between entry and stop if the market is 500.00 and falling with your buy-open order 499.00 ~ stop 497.50 if it trades down to or below your stop.
On the other hand, if the same scenario sees TF price action trade to 498.90 and there are one hundred contracts offered resting at 499.00 ~ 498.90 collectively and your twenty-lot to buy open order is part of one hundred fifty waiting to fill in the same span, someone(s) in that collective group will not get filled the extra fifty contracts above open interest available on limit orders. Market orders to open will completely fill, with some degree of slippage involved. What commonly happens with bigger orders will be (for example) -1.5pt loss on 20 contracts first trade, 0pt loss on 20 contracts second trade, +5pt gain on 12 contracts third trade. First trade went -$3,000 with the second trade a scratch and the third trade +$6,000 gross. Sounds fine overall, but the winning trade should have been +$10,000 instead. Remember, there is never a problem getting complete fills in any market on all losing trades when price action moves against. There is often a problem getting complete fills in the TF specifically when price action works out in favor of the trade.
It’s a somewhat simple matter for retail traders to fill block orders across several ticks’ distance to ensure complete fills. If trying to turn 20-contract lot positions short (for example) at 500.00 level to open, a trader can stage ten contracts at 500.00 and ten at 499.80. If the market is trading below there and expected fill happens with a price rise from below into the 500.00 trigger, half the position would easily fill before that trigger was hit. Therefore, if price action stalled out just below 500.00 and dropped dead from there, you would have 1/2 a short position open to profit from that move instead of none on a no-fill situation.
If price action rises through 499.80 and into 500.00 it would easily fill your entire contracts order. The net average fill would be 499.90 blended, giving up roughly one tick to ensure the entire block gets filled.
If price action is trading above 500 and falls thru your trigger on a breakdown sell, the entire position would fill as price action dropped in favor of momentum lower. Staging orders across spread tick strikes to enter on pullbacks lessons the occurrence of partial fills, within reason. No one is going to fill TF 100-contract lots regularly without significant slippage or partial fills needing to be dealt with. However, I highly doubt anyone here in this conversation is stumped with dealing through 100-lot TF flips anyway. That’s all part & parcel of why TF futures are more trendy and directional than other e-minis… relatively unfettered by sideways hedging tactics of those big money players.
This is what keeps large spec and commercial traders out of the arbing business with TF futures. They cannot manage risk on every position all of the time due to reality of partial fills = illiquidity. The fact that TF futures are too illiquid for commercial arbing & sideways strategies is, once again fundamentally what creates appeal towards the TF e-mini market for many retail traders. Too small for big-money manipulation, plenty big enough for retail traders to aptly profit from.
TF Daily Chart
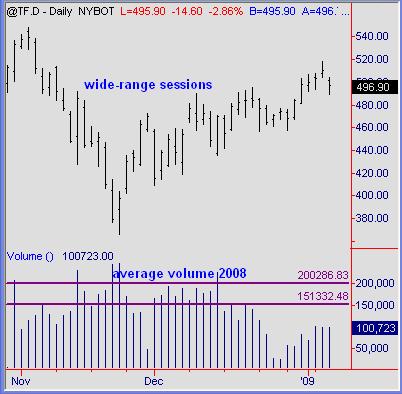
Average volume for the TF contract when it became the sole instrument for Russell 2000 futures last fall quickly rose to a range between 150,000 and 200,000+ contracts traded daily. That is what we can consider “normal” volume and flow for this fledgling e-mini contract. During that time the intraday ranges were rather wide and usually directional, be it up or down.
Compare that to average volume traded during the first four sessions of 2009. A total of 75k to 100k contracts were turned, inside four rather narrow-range sessions. At a time when traders would expect normal to high volume and expanding price action, TF futures have begun 2009 in a funk. When volume returns to that 200k daily average or above, we should expect normal price behavior to follow suit. For this moment in time the TF is too thin for trading any amount of multiple contract size consistently on fills. It behaves exactly like the S&P 400 midcap futures contract listed on CME, which is also way too thin for anything other than 1-contract lot trading efforts.
Leading Market Indicator
Stock market traders search for all manner of leading indicators or market “tells” that offer a head’s up glimpse of which direction will turn next. A few recent examples are the behaviors of correlated and also non-related markets such as gold, crude oil, USD/JPY pair, bond futures, AAPL or GOOG stocks, financial stocks or sectors. All of these varied markets have some influence on the broad stock market at times. All of them fail to have any effect on leading the broad market at other times.
Relationships like that are always temporary and usually fleeting. Whereas the price of crude oil rising once pushed stock prices lower, rising crude prices now signal stock markets going the same direction. Huh? Why is that? Well, when crude oil prices were (briefly) at nosebleed levels, it was considered inflationary pressure on the overall stock market. It was also used as a quasi-hedge for USD prices versus other currencies as well. Now that crude oil futures have shed -$110 per barrel from those record highs, oil no longer imparts any pressure on stocks. Instead, it is viewed as a barometer to the overall economy’s health or lack thereof.
The same has been done for gold futures at other times. Currency pairs like USD/JPY track the infamous “carry trade” which impacted stock market behavior… for a little while. None of those temporary market-influence tools can be relied upon for years of unchanging, dependable leading indications of what the general marketplace (i.e. indexes) will do next.
Summation
Russell 2000 e-mini futures (TF) are not “the best” symbol to trade. Truth is, there isn’t a superior choice of the group. S&P 500 futures (ES) will always be king of size. Nasdaq 100 futures (NQ) may be considered the smoothest overall e-mini to trade, relatively speaking. Dow 30 futures (YM) have their fan base as well. TF futures seem to be in a state of development towards stability and consistency of performance. They blossomed well from September (sole listing) through mid-December in volume and open interest. Since the start of 2009 a few days ago, traded size has taken two steps back from earlier peak. When volume and open interest reaches prior average highs or beyond, a return to normalcy should follow.
Austin Passamonte is a full-time professional trader who specializes in E-mini stock index futures and commodity markets. Mr. Passamonte’s trading approach uses proprietary chart patterns found on an intraday basis. Austin trades privately in the Finger Lakes region of New York. Click here to visit CoiledMarkets