How to Trade Reversals With Fibonacci Retracements
Fibonacci Retracement is a leading indicator that is used to predict future price movement of a currency pair. This indicator can be used in different trading markets such as stocks, ETFs, futures and forex. Well what is Fibonacci and how does it work?
Fibonacci Retracement was discovered by Leonardo Fibonacci in the 12th century. Leonardo realized a proportion in the building blocks of nature. The Golden rule, as it’s called, is the proportion of things in the larger picture. Fibonacci Retracement says out of a larger movement the price will retrace a certain percentage of that larger move before continuing in the original direction. The mean for those percentages is 61.8%. This number is the Golden Rule.
Click here to learn how to utilize Bollinger Bands with a quantified, structured approach to increase your trading edges and secure greater gains with Trading with Bollinger Bands® – A Quantified Guide.
The proportion Leonardo figured out was that 61.8% of the distance between your head and your feet is your belly button. Your elbow rests at the 61% proportion of your total arm distance. In a beehive the bees consist of 61% males to females. The list goes on and on. How can we use this to trade? We can use it in trading markets because these same proportions exist there as well.
If you draw a line from the peak of the high and the lowest of the low you have what is called the larger movement.
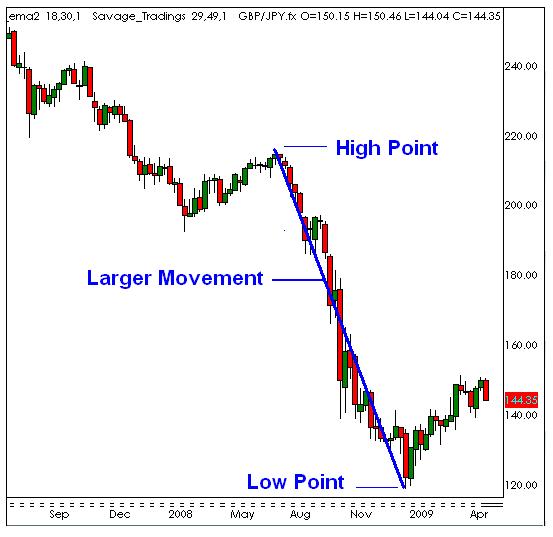
The goal is to find a large movement. Large meaning a definite high and low point. You can use Fibonacci almost as well on smaller chart time frame. I only say almost because the larger the time frame the more reliable most signals and strategies are.
So, here we have found our high and low point. Then we will need to draw the Fibonacci line in the direction of the movement. Here our movement is downward, so we draw the line from the top to the bottom. The indicator will then draw the percentages automatically of that movement. It will draw the line at 50% retracement. This is 50% of the larger movement. 50% retracement means if the price retraces back to that line it has retraced 50%. There are other lines and proportions drawn automatically as well; 38.2%, 61.8%, 78.6%, retracements. There are several other retracement percentages, but these are the ones that are predominantly utilized in trading.
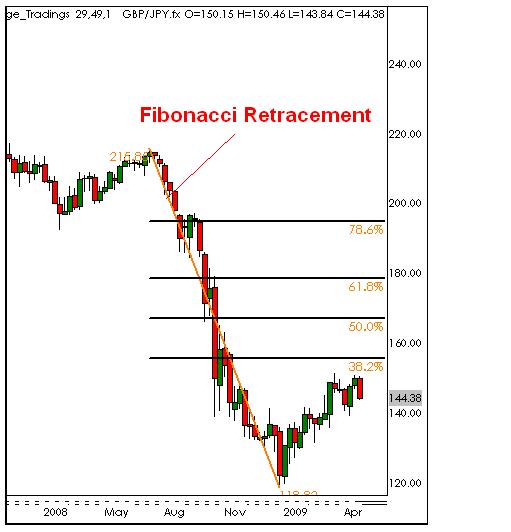
If you notice on the chart above the lines are drawn. There are options within the properties of the Fibonacci indicator to show price instead of percentages. We will use percentage here so you can visually see the retracement areas. The Fibonacci is drawn, but it’s not yet correct. At this point you’ll need to do some slight modifications.
The secret is that sometimes you have to adjust the Fibonacci. As the pair is falling it is not quite reacting to the Fibonacci Lines. This means that there needs to be an adjustment. I can’t stress this point enough on how crucial this is. Nothing is exact when trading using charts. So, we must make slight adjustments to our lines being drawn. You want as many candles to line up with as many support/resistance lines of the Fibonacci Retracement lines as possible. Take a look at the chart below and compare it to the chart above. Can you see how the candles line up better on the way down? Can you see now the price is trading around the 38% retracement?
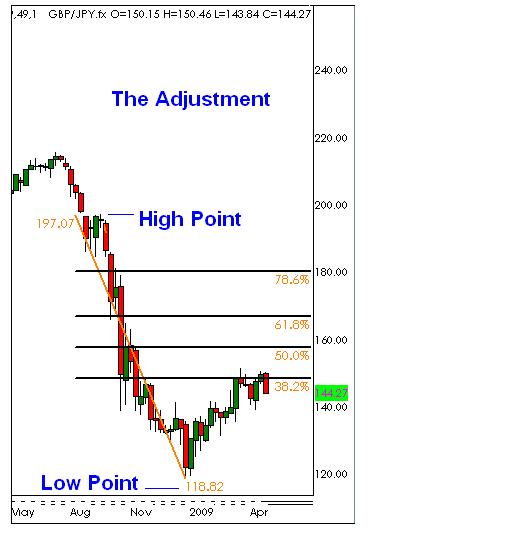
Now that we have adjusted the Fibonacci Retracement we can look for ways to trade this technical Analysis.
There are two main ways to trade using Fibonacci:
1.) When the pair retraces to one of the percentage support lines you trade back in the original direction. In this case the pair retraces back to 38.2% retracement. At this point my bias would be to sell. I would use the retracement line as my support line of further decline. If the line doesn’t support then you go to your next trading method.
2.) If the retracement line is broken then it turns into a support line holding the pair to continue to retrace. The next retracement line is the 50% retracement. In this case once the pair breaks through the retracement line, you can go in the direction of the next retracement line. In this instance we would buy at 38.2% retracement with a target to the 50% retracement line.
When the pair hits the 50% retracement then you would trade using method one. The reason you go with the main direction when support is hit is because technically if the pair stays above the 61.8% retracement that movement (trend) is still in tact. So, the motto is always going with the trend.
Joseph Hopkins is a professional trader and is currently a columnist for TradersChoiceFX.com . You can find many more of his articles on the TradersChoiceFX Forex Blog. You can download a free Metatrader Practice Account from TradersChoiceFX and get instant access to a special report that will teach you how to use a Forex bonus program to improve your success as an FX trader.