The Squeeze Play
Like most traders in the U.S., my first experiences involved
stock trading. After a rough start, I built a track record that I was able to
parlay into a job on Wall Street.
The fact that I didn’t live in New York at the time was a minor detail, and soon
I was getting up at around 4:00 AM to begin the trek to work. I would exit my
train beneath the World Trade Center, meet up with some co-workers for coffee,
and prepare for the all-out war that would begin every day at 9:30 AM.
Eventually I was lured away by another firm, and began working on another
trading desk in Manhattan. I moved to New York City, shortening my daily commute
from two hours each way to two blocks.
One of the many benefits of living and working in New York City is exposure to
people and cultures from around the world. One of the “new” concepts (at least
it was new to me) to which I was exposed at this time was the currency market.
Once I learned about the advantages of forex trading, I was hooked.
I like to focus on market tendencies that are easy to identify and rooted in
logic. One of the more dependable recurring market tendencies is the cycle of
volatility — the concept that periods of high volatility are usually followed
by periods of low volatility, and vice versa.
This cycle can be observed in almost any trading market, but it’s most closely
identified with options trading. Options traders write put and call contracts
during periods of high volatility, to collect the “premium” — the cost of the
contract. The premiums attached to these contracts tend to be fatter when
markets are volatile.
The option writer assumes volatility will return to normal levels in the future,
allowing him to buy back the contracts at a reduced premium. In the world of
options, this concept is referred to as “selling volatility”. This cycle of
volatility can also be observed in the Forex market.
There’s a simple reason for this. When a market is trending, as the Forex market
often does, the participants have a definite opinion as to the direction of the
trade. When a currency pair begins to trend, traders are showing a strong
preference for one currency over another.
During strong trends, the market is volatile because the price is on the move.
The perception of value has changed and the price must move to reflect this
change of opinion.
After a while, a currency pair will reach a point where traders feel that the
exchange rate is fairly valued. The bulls and the bears reach an agreement — at
least temporarily — that the pair is reasonably priced. At this point, the
trend pauses and the pair will enter a period of consolidation.
But the pair can’t stay trapped in these doldrums forever. The bulls and bears
may have reached a temporary truce, but eventually new information will be
introduced into the market, and the perception of value will change as this news
is digested.
Moving averages can be used as one indication of volatility. In Figure 1, the
20-period exponential moving average (EMA) bounces wildly during a volatile
period. As the pair transitions from high to low volatility, the 20- period EMA
begins moving sideways. The flat 20- period EMA is one indication that the trend
has paused, at least temporarily, and the price has entered the consolidation
phase
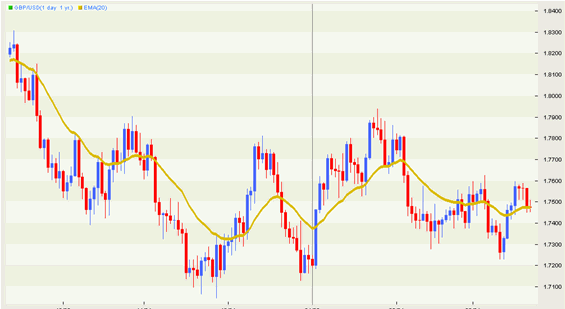
Figure 1 — On the daily chart, GBP/USD consolidates after a volatile period
In order to confirm that a trade is setting up, let’s add two indicators that
measure volatility. If these indicators are falling, volatility is falling. Once
volatility contracts, the currency pair has settled into a period of
consolidation, which could lead to a powerful breakout.
The first of these indicators is average true range (ATR), which measures the
average trading range of a pair over a given period of time. In this case, we
are measuring the range based on the daily chart, using the default parameter of
14-periods. As we can see in Figure 2, the ATR indicator is falling, meaning
that the average daily range is shrinking, and volatility is decreasing.
Bollinger bands also measure volatility. Bollinger bands split open when
volatility is high, and converge when volatility falls. Instead of using the
bands themselves, we can use the Bollinger band width indicator, which is simply
a measure of the space between the Bollinger bands. We can see in Figure 2 that
the Bollinger band width indicator has fallen to near its lows, again confirming
that we are in a period of consolidation.
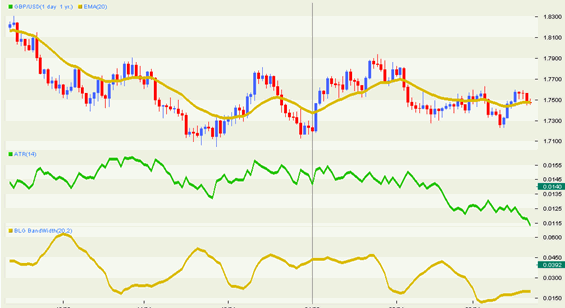
Figure 2 ATR and Bollinger Band Width indicate that volatility is falling
We have confirmed that volatility is falling, but this doesn’t give us an
indication as to the direction of any potential breakout. This is because
volatility has no directional bias; we don’t know the direction of the next
move, we only know that a move is imminent. So, we need to prepare for a
breakout in either direction.
We can do this by adding trendlines to the chart, and by targeting a break above
or below a trendline as an entry point for a directional trade. If the upper
trendline breaks, we’ll go long and if the lower trendline breaks, we’ll sell
short.
To guard against a false breakout, place a stop below the upper trendline in the
case of a long trade, and above the lower trendline if we enter a short trade.
Note that the two trendlines form a symmetrical triangle, a common formation
during times of low volatility (Figure 3).
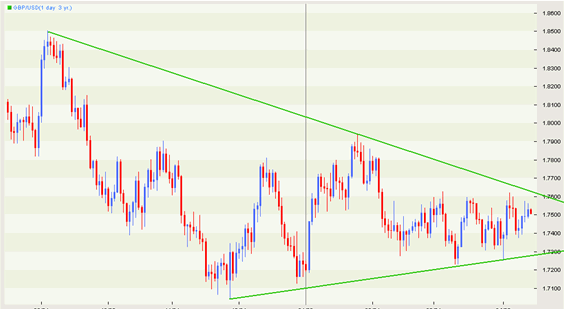
Figure 3 Symmetrical Triangles are common in low-volatility markets
When determining our exit points, we want to consider price areas that have
previously acted as support or resistance, as well as major Fibonacci
retracements and round numbers (see Figure 4).
For example, if the price breaks down past the lower trend line, initiating a
short sale, the level of 1.7150 is one choice for a potential exit, because of
prior support in that area. A further area of support would be 1.7050, which is
the approximate low of the downtrend.
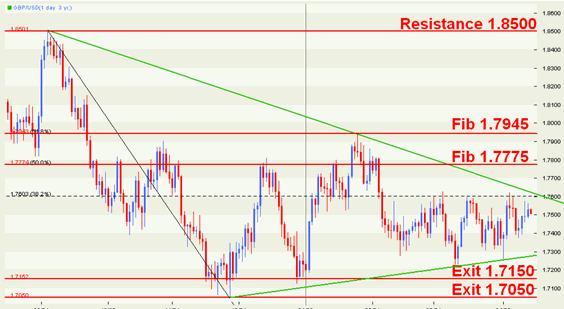
Figure 4 Use of support/resistance, round numbers and Fibonacci to determine
exits
What if the price breaks the upper trendline, indicating that we should enter a
long trade? For resistance levels, we can draw a Fibonacci retracement of the
major downward move from 1.8500 to 1.7050. The 50% retracement of this
downtrend, located near 1.7775, makes a compelling exit point.
The 61.8% Fib retracement of the same downtrend could be used as an additional
exit. If we reach the first exit point, we can exit part of the position and
raise the stop to the breakeven point on the remaining portion of the trade.
The round number 1.8500 is the peak of the prior trend and a previous resistance
level, so this could be used as an additional exit point. It would also
represent a 100% retracement of the downtrend.
The longer the amount of time spent in the consolidation phase, the stronger the
breakout tends to be. Why would this be true? During the time that the price is
trading in a narrow range, there are buyers and sellers taking positions.
Because the price is not moving very much, these traders have little reason to
exit their trades.
But if a breakout does occur, a large number of traders will be caught on the
“wrong side” of the market, regardless of the direction of the breakout. As
these traders cover their positions, they provide fuel for the breakout, helping
to push the price further away from the consolidation area.
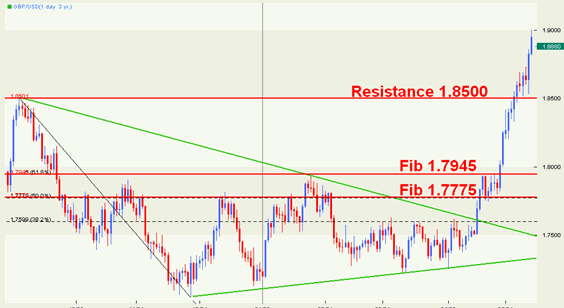
Figure 5 Volatility returns with a vengeance
Finally, the GBP/USD pair blasts out of the triangle and races to reach its
targets, as volatility returns with a vengeance. This forceful move carried
cable all the way to 1.9000, a move of nearly 1500 pips (see Figure 5).
Although this example takes place on the daily chart, similar setups occur in
other time frames. The logic behind the setup, and the forex market’s tendency
to break out after a period of consolidation, holds true in both long and short
time frames.
Traders will see this setup occur over and over again. It works well because the
recurring cycle of volatility is made constant by human behavior. Markets may
change and traders may come and go, but human nature essentially remains the
same.
Ed Ponsi is the President of
FXEducator.com and is the former Chief
Trading Instructor for Forex Capital Markets. An experienced professional trader
and money manager, Ed has advised hedge funds, institutional traders, and
individuals of all levels of skill and experience. He is a regular contributor
to SFO Magazine, The Pristine View, and FX Street, and is currently writing his
first book for Wiley Finance. Ed’s new DVD series, “FXEducator: Forex Trading
with Ed Ponsi” is now available at
www.fxeducator.com and from select distributors worldwide. For more
information, email us at info@fxeducator.com.
New! Improve your Leveraged ETF trading with a simple and powerful rating system. Click here now.
