Why RSI May Be One of the Best Short-Term Indicators
 This article was originally published in 2007, and was based on research involving 7,050,517 trades from Jan 1, 1995 to June 30, 2006. We applied a price and liquidity filter that required all stocks be priced above $5 and have a 100-day moving average of volume greater than 250,000 shares. This research has been updated through 2010 and currently involves 11,022,431 simulated trades.*
We consider the Relative Strength Index (RSI) to be one of the best indicators available. There are a number of books and articles written about RSI, how to use it, and the value it provides in predicting the short-term direction of stock prices. Unfortunately, few, if any, of these claims are backed up by statistical studies. This is very surprising considering how popular RSI is as an indicator and how many traders rely upon it.
Click here to learn exactly how you can maximize your returns with our new 2-Period RSI Stock Strategy Guidebook. Included are dozens of high-performing, fully quantified stocks strategy variations based around the 2-period RSI.
Most traders use the 14-period RSI, but our studies have shown that statistically, there is no edge going out that far. However, when you shorten the timeframe you start seeing some very impressive results. Our research shows that the most robust and consistent results are obtained by using a 2-period RSI and we have built many successful trading systems that incorporate the 2-period RSI.
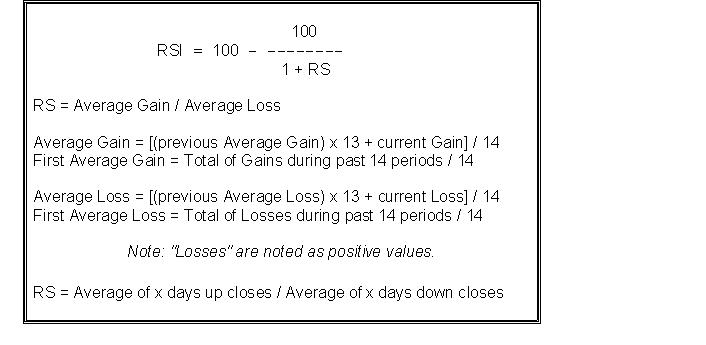
Before getting to the actual strategy, here’s a little background on the RSI and how it’s calculated.
Relative Strength Index
The Relative Strength Index (RSI) was developed by J. Welles Wilder in the 1970’s. It is a very useful and popular momentum oscillator that compares the magnitude of a stock’s recent gains to the magnitude of its recent losses
A simple formula (see below) converts the price action into a number between 1 and 100. The most common use of this indicator is to gauge overbought and oversold conditions – put simply, the higher the number the more overbought the stock is, and the lower the number the more oversold the stock is.
As mentioned above, the default/most common setting for RSI is 14-periods. You can change this default setting in most charting packages very easily but if you are unsure how to do this please contact your software vendor.
2-Period RSI
We looked at over eleven million trades from 1/1/95 to 12/30/10. The table below shows the average percentage gain/loss for all stocks during our test period** over a 1-day, 2-day, and 1-week (5-days) period. These numbers represent the benchmark which we use for comparisons.
We then quantified overbought and oversold conditions as measured by the 2-period RSI reading being above 90 (overbought) and below 10 (oversold). In other words we looked at all stocks with a 2-period RSI reading above 90, 95, 98 and 99, which we consider overbought; and all stocks with a 2-period RSI reading below 10, 5, 2 and 1, which we consider oversold. We then compared these results to the benchmarks, here’s what we found:
 Oversold
- The average returns of stocks with a 2-period RSI reading below 10 outperformed the benchmark 1-day (+0.08%), 2-days (+0.20%), and 1-week later (+0.49%).
- The average returns of stocks with a 2-period RSI reading below 5 significantly outperformed the benchmark 1-day (+0.14%), 2-days (+0.32%), and 1-week later (+0.61%).
- The average returns of stocks with a 2-period RSI reading below 2 significantly outperformed the benchmark 1-day (+0.24%), 2-days (+0.48%), and 1-week later (+0.75%).
- The average returns of stocks with a 2-period RSI reading below 1 significantly outperformed the benchmark 1-day (+0.30), 2-days (+0.62%), and 1-week later (+0.84%).
When looking at these results, it is important to understand that the performance improved dramatically each step of the way. The average returns of stocks with a 2-period RSI reading below 2 were much greater than those stocks with a 2-period RSI reading below 5, etc.
This means traders should look to build strategies around stocks with a 2-period RSI reading below 10.
Overbought
-
The average returns of stocks with a 2-period RSI reading above 90 underperformed the benchmark 2-days (0.01%), and 1-week later (0.02%).
-
The average returns of stocks with a 2-period RSI reading above 95 underperformed the benchmark and were negative 2-days later (-0.05%), and 1-week later (-0.05%).
-
The average returns of stocks with a 2-period RSI reading above 98 were negative 1-day (-0.04%), 2-days (-0.12%), and 1-week later (-0.14%).
-
The average returns of stocks with a 2-period RSI reading above 99 were negative 1-day (-0.07%), 2-days (-0.19%), and 1-week later (-0.21%).
When looking at these results, it is important to understand that the performance deteriorated dramatically each step of the way. The average returns of stocks with a 2-period RSI reading above 98 were significantly lower than those stocks with a 2-period RSI reading above 95, etc.
This means stocks with a 2-period RSI reading above 90 should be avoided. Aggressive traders may look to build short selling strategies around these stocks.

As you can see, on average, stocks with a 2-period RSI below 2 show a positive return over the next week (+0.75%). Also shown is that, on average, stocks with a 2-period RSI above 98 show a negative return over the next week. And, just as the other articles in this series have shown, these results can be improved even further by filtering stocks trading above/below the 200-day moving average and combining the 2-period RSI with PowerRatings.
Recent Examples
Chart 1 (below) is an example of a stock that recently had a 2-period RSI reading below 2:
Chart 1
Chart 2 (below) is an example of a stock that recently had a 2-period RSI reading above 98:
Chart 2
Our research shows that the Relative Strength Index is indeed an excellent indicator, when used correctly. We say “when used correctly” because our research shows that it is possible to catch short-term moves in stocks using the 2-period RSI, but it also shows that when using the “traditional” 14-period RSI there is little/no value to this indicator. This statement cuts to the very essence of what TradingMarkets represents – we base our trading decisions on quantitative research. This philosophy allows us to objectively assess whether a trade offers a good risk/reward opportunity and what might happen in the future.
This research we’re presenting here is just the tip of the iceberg using the 2-period RSI. For example, greater results can be found by looking for multiple day readings under 10, 5 or 2. And, even greater results can be achieved by combining the readings with other factors such as buying a low level RSI stock if it trades 1-3% lower intraday. As time passes we’ll share some of these research findings, along with handful of trading strategies with you.