Anticipating High Probability Market Turns
From 1990 to 1997, Kevin Haggerty served as Senior Vice President for Equity Trading at Fidelity Capital Markets, Boston, a division of Fidelity Investments. He was responsible for all U.S. institutional Listed, OTC and Option trading in addition to all major Exchange Floor Executions. For a free trial to Kevin’s Daily Trading Report, please click here.
Commentary for 9/30/11
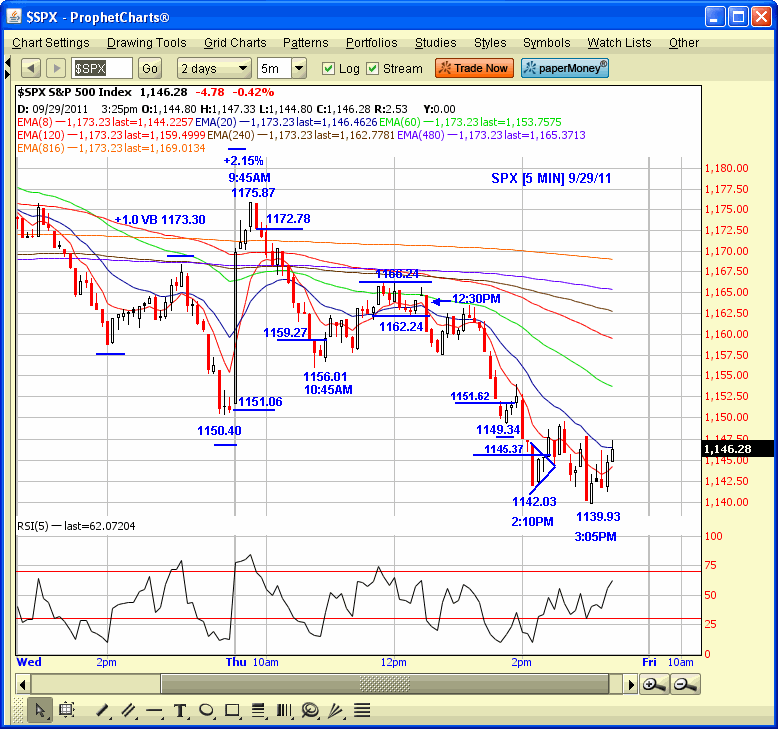
The previous commentary was on 9/22 and the SPX finished -3.2% that day and -6.5% on the week. The intraday low on 9/22 was 1114.22, down from the 1220 resistance on 9/22, and has since rallied +7.3% to the 1195.86 intraday high on Tues. It then declined -4.7% to the 1139.93 intraday low yesterday, before the last hour “magic move” into the 1160.40 close, but as I am doing this commentary this morning it has traded down to an 1140.68 low. It is the end of Q3 today, so a repeat of another late S&P 500 futures induced “magic move” will not be a surprise.
The increased volatility is obviously positive for day traders, but the daily price action is dictated by the headline European sovereign debt news, and to a lesser extent by the obvious global slowdown, which in reality is also a recession in the real world for the US, but the media pundits are reluctant to admit that because they might get a “bully warning” from the current administration, which is either totally incompetent, or just sticking to their plan to grow Government at the expense of the private sector, and create an even bigger welfare state we have already.
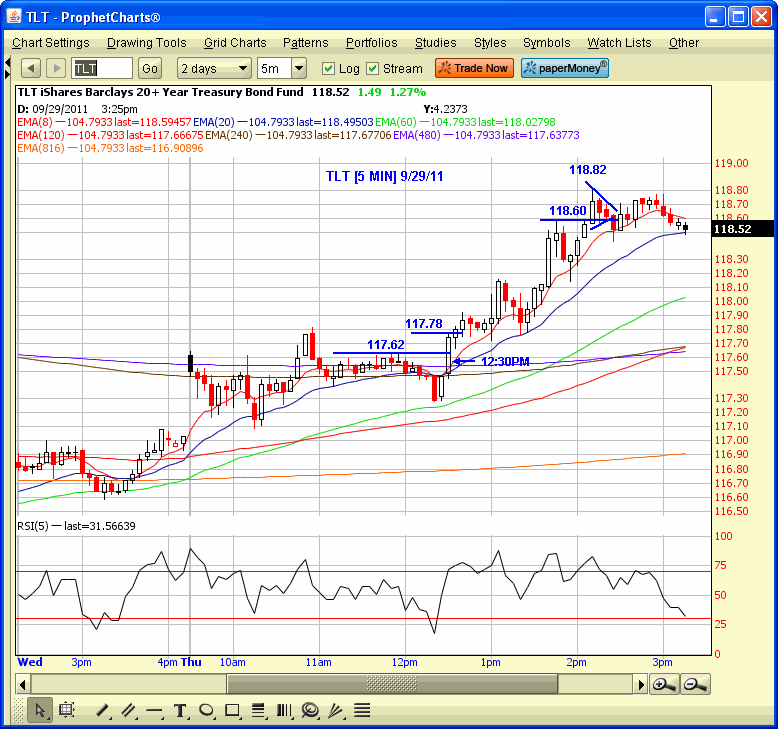
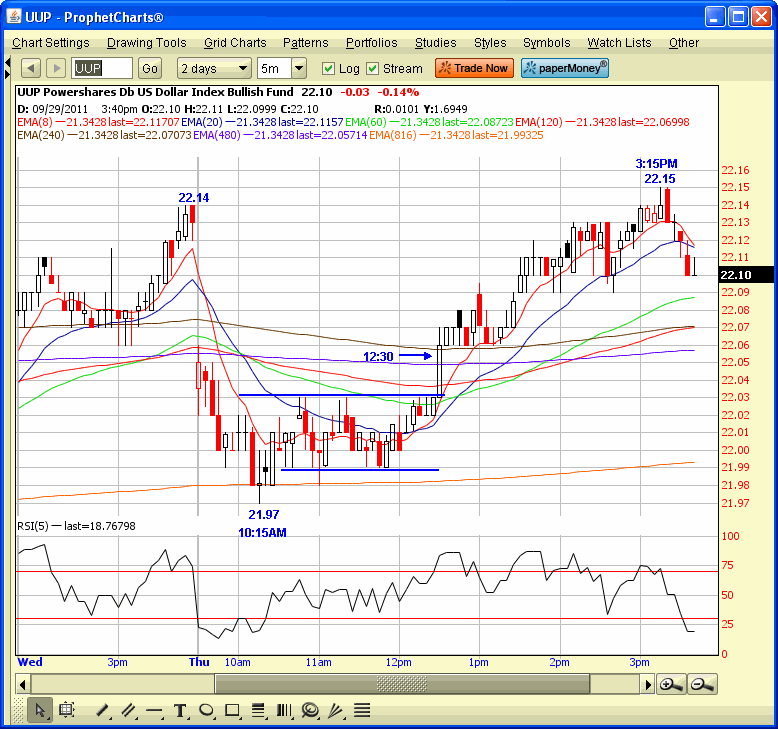
The USD correlation sets up multiple day trading opportunities and I have included some actual Trading Service strategy trades from yesterday which highlights the short SPX/long TLT opportunity keyed off the 12:30PM bar range B/O by the UUP [USD] The SPX B/O of a 9 bar range below 1162.24, and also below all the EMA`s, eventually made an intraday 1139.93 low before the vertical last hour manipulation to finish at 1160.40.
However, the ridiculous SPX +2.15% opening period move to 1175.87 on the 9:45AM bar, on essentially nothing of significance, set up the extended VB trade on the short side to start the day. The inside bar short entry below 1172.70 versus the +1.0 VB at 1173.70 was banked on a 3.27 point reversal after the 1156.01 low on the 10:45AM bar. That was followed by the 12:30PM bar intermarket correlated trade trade on the short side in the SPX, and/or long side in the TLT.
There were many other opportunities on the equity long side that were signaled by the 12:30PM bar UUP range B/O but these were the obvious ones yesterday based on the USD correlation.
It is tough to have anything other than a negative market bias, and I still think the SPX will break the 1101.54 low and .382RT to 667 from 1370.58 That will bring the .50RT at 1019 [-25.6%], and .618RT at 936 [-31.7%] into play. The DAX has already declined -34.6% in this bear market from 7600 to 4966, made a possible double bottom at 4974 the other day, and closed at 5640 today, or + 13.3% in 5 days. There is a short term change in trend if it can take out and sustain a move above 5656, but the odds favor the US equity market going lower.
There is some significant Pi symmetry from the 3/6/09 bear market low in mid-Oct, and also some long term Fib time symmetry in the end of Oct based on the 10/10/02 769 and the 3/6/09 667 bear market bottoms. You can get the complete description of all the Oct symmetry by taking a one week trial subscription to the Trading Service and checking the commentary for 9/2911.
The monthly SPX 5 RSI is 22.56, which is the most O/S since the 3/6/09 667 monthly low, which was 5.69 The SPX topped out at 1371 on a key Pi date from 3/6/09 bottom, with the monthly 5 RSI at 85.01 The trading service members were all over that opportunity because they recognized the key elements in identifying significant market turning points. If the market makes new lows and sells off into Oct then we will have another high probability market opportunity on the long side which would take the SPX back to at least the 12 month declining EMA which is now 1240 or at a minimum to the 1228.75 .618RT to 1576 from 667.


Click here to find full details on Kevin’s courses including Trading with the Generals with over 20 hours of professional market strategies. And for a free trial to Kevin’s daily trading service, click here.
